Buyer's Market
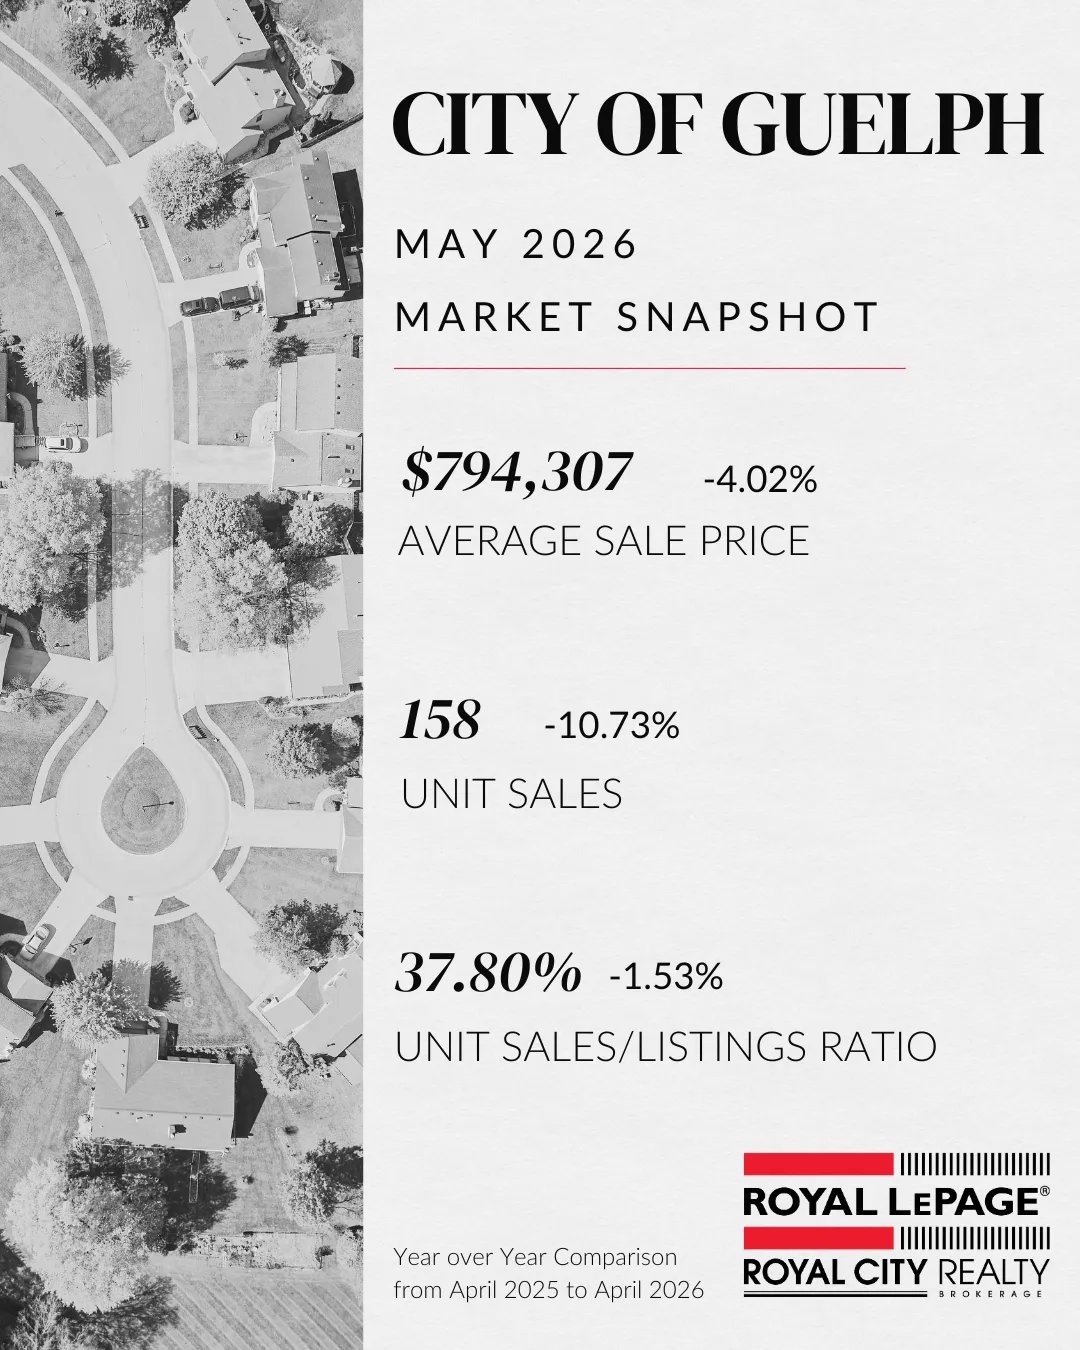
The City of Guelph remained in buyer’s market territory in May as inventory levels continued to outpace sales activity. The median sale price declined 7.78% year over year to $737,750, while the average sale price decreased 4.02% to $794,307. Sales volume fell 14.32% to $125.50M, with unit sales decreasing 10.73% to 158 transactions. New listings declined 7.11% to 418, while expired listings dropped 19.05% to 34. The unit sales-to-listings ratio edged lower to 36.45%, down 5.39% from last year. Although market conditions improved slightly from April, the ratio remains below the 39% threshold, keeping the City of Guelph firmly in buyer’s market territory.
May Numbers
Median Sale Price $737,750
-7.78%
Average Sale Price $794,307
-4.02%
Sales Volume $125,500,453
-14.32%
Unit Sales 158
-10.73%
New Listings 418
+7.11%
Expired Listings 34
-19.05%
Unit Sales/Listings Ratio 37.8%0
-1.53%
Year-over-year comparison
(May 2026 vs. May 2025)
May Year-Over-Year Sales Volume of $125,500,453
Down -14.32% from 2025’s $146,473,543 with unit sales of 158 down -10.73% from last May’s 177. New listings of 418 are down -7.11% from a year ago, with the sales/listing ratio of 37.80% down -1.53%.
Year-To-Date Sales Volume of $455,155,483
Down -16.87% from 2025’s $547,543,656 with unit sales of 601 down -12.77% from 2025’s 689. New listings of 1,649 are up +0.12% from a year ago, with the sales/listing ratio of 36.45% down -5.39% from a year ago.
Year-To-Date Average Sale Price of $752,141
Down from $792,029 one year ago, with a median sale price of $725,000 down from $778,000 one year ago. Average days-on-market of 37 is up 8 days from last year.