
Andra Arnold & Associates are a Top Rated, Award-Winning Guelph real estate team that has a passion for helping people. We truly live by our motto “Here to Help”. Our team brings quality expertise to our clients’ buying and selling experiences. The team's dedication, eagerness to help, and experience allow clients navigate one of life’s biggest decisions!
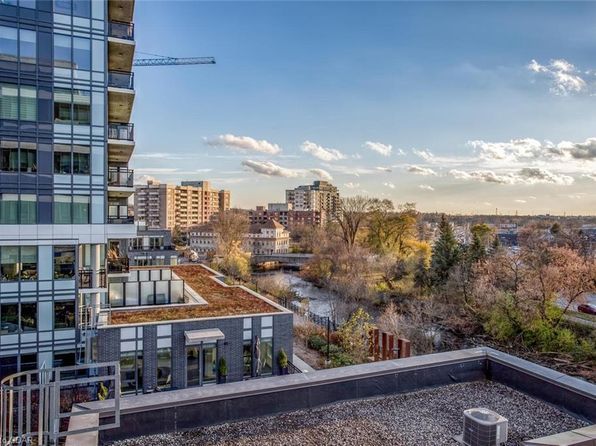
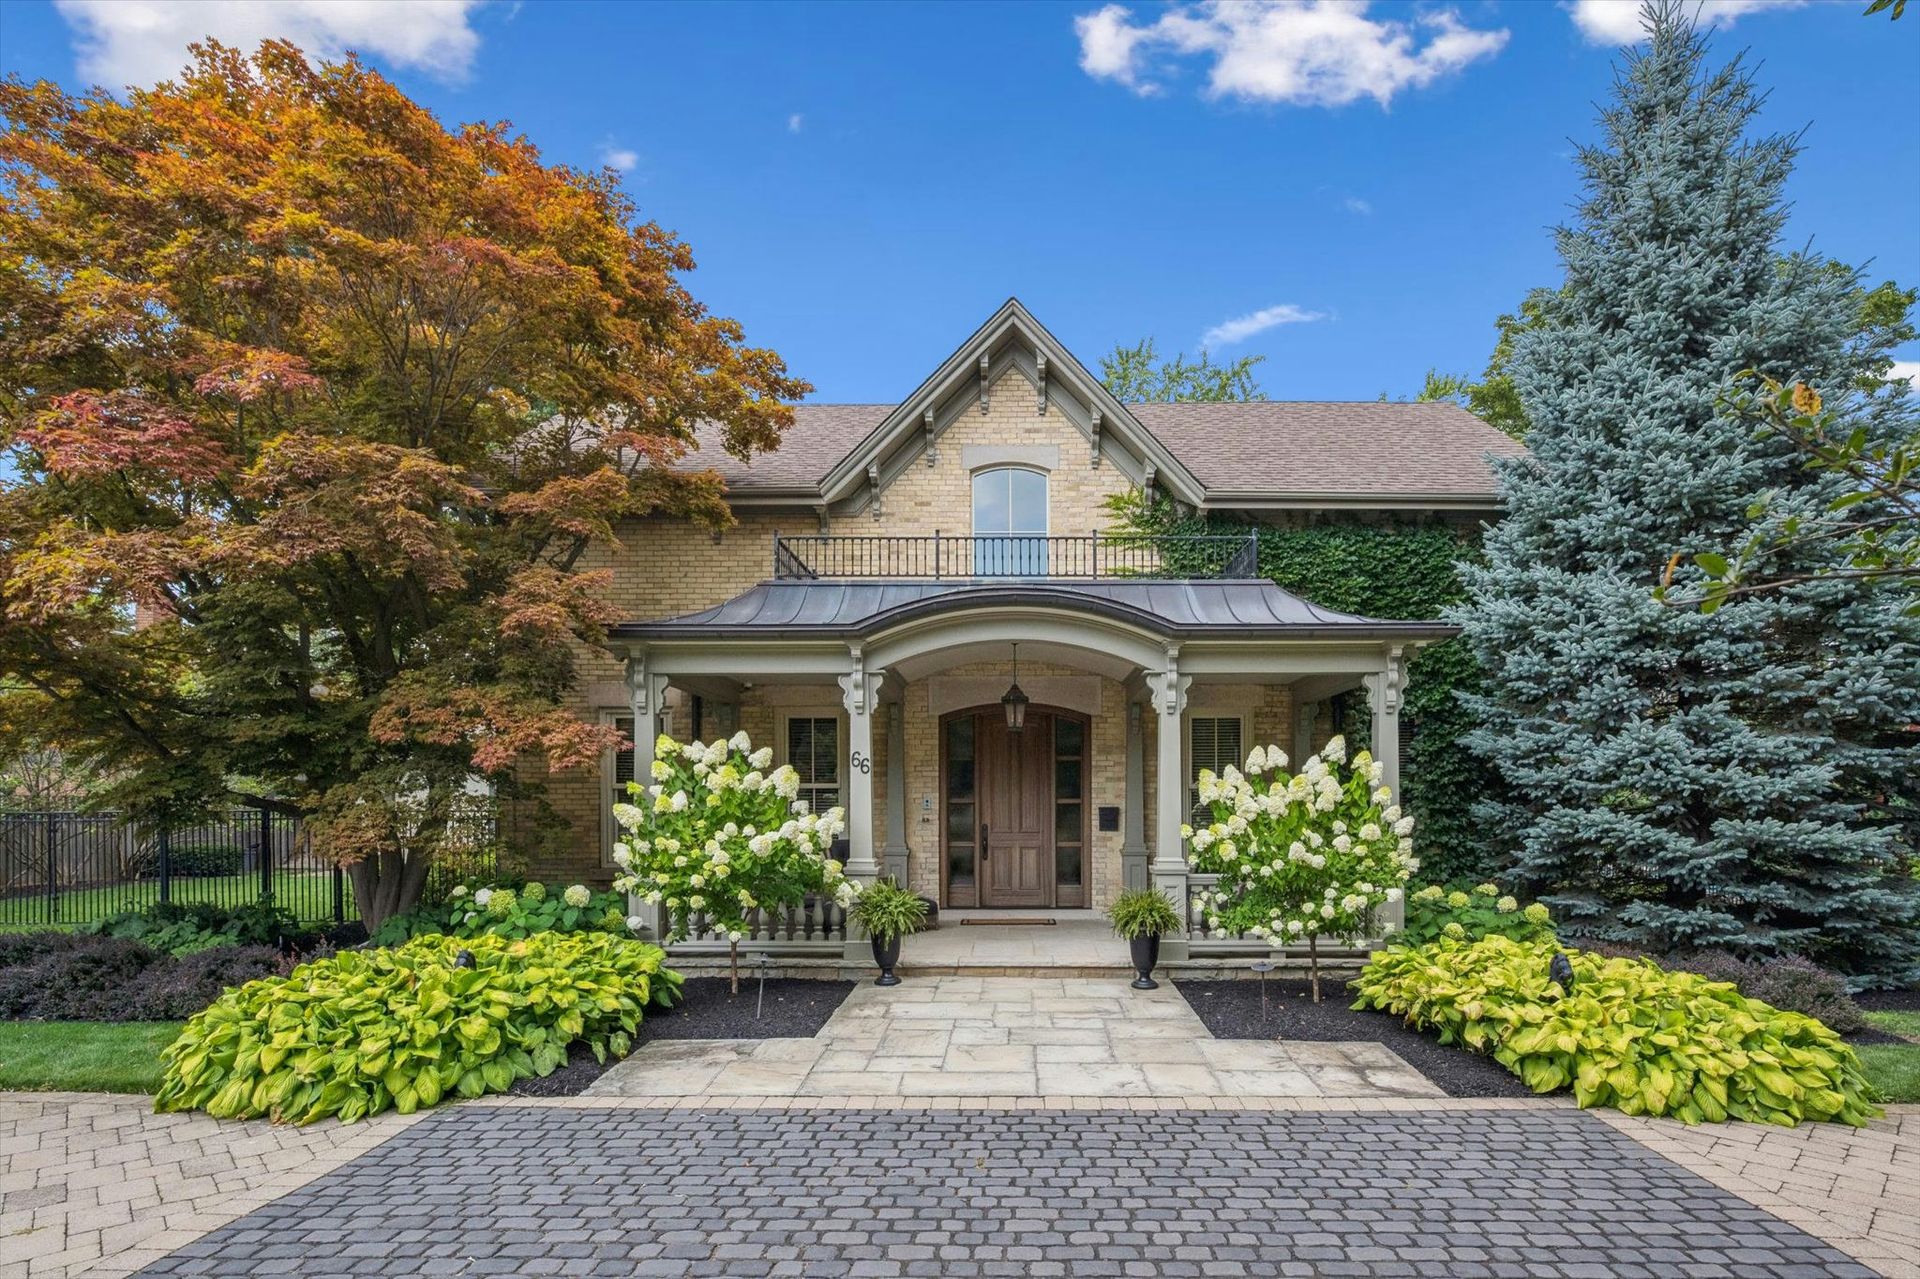
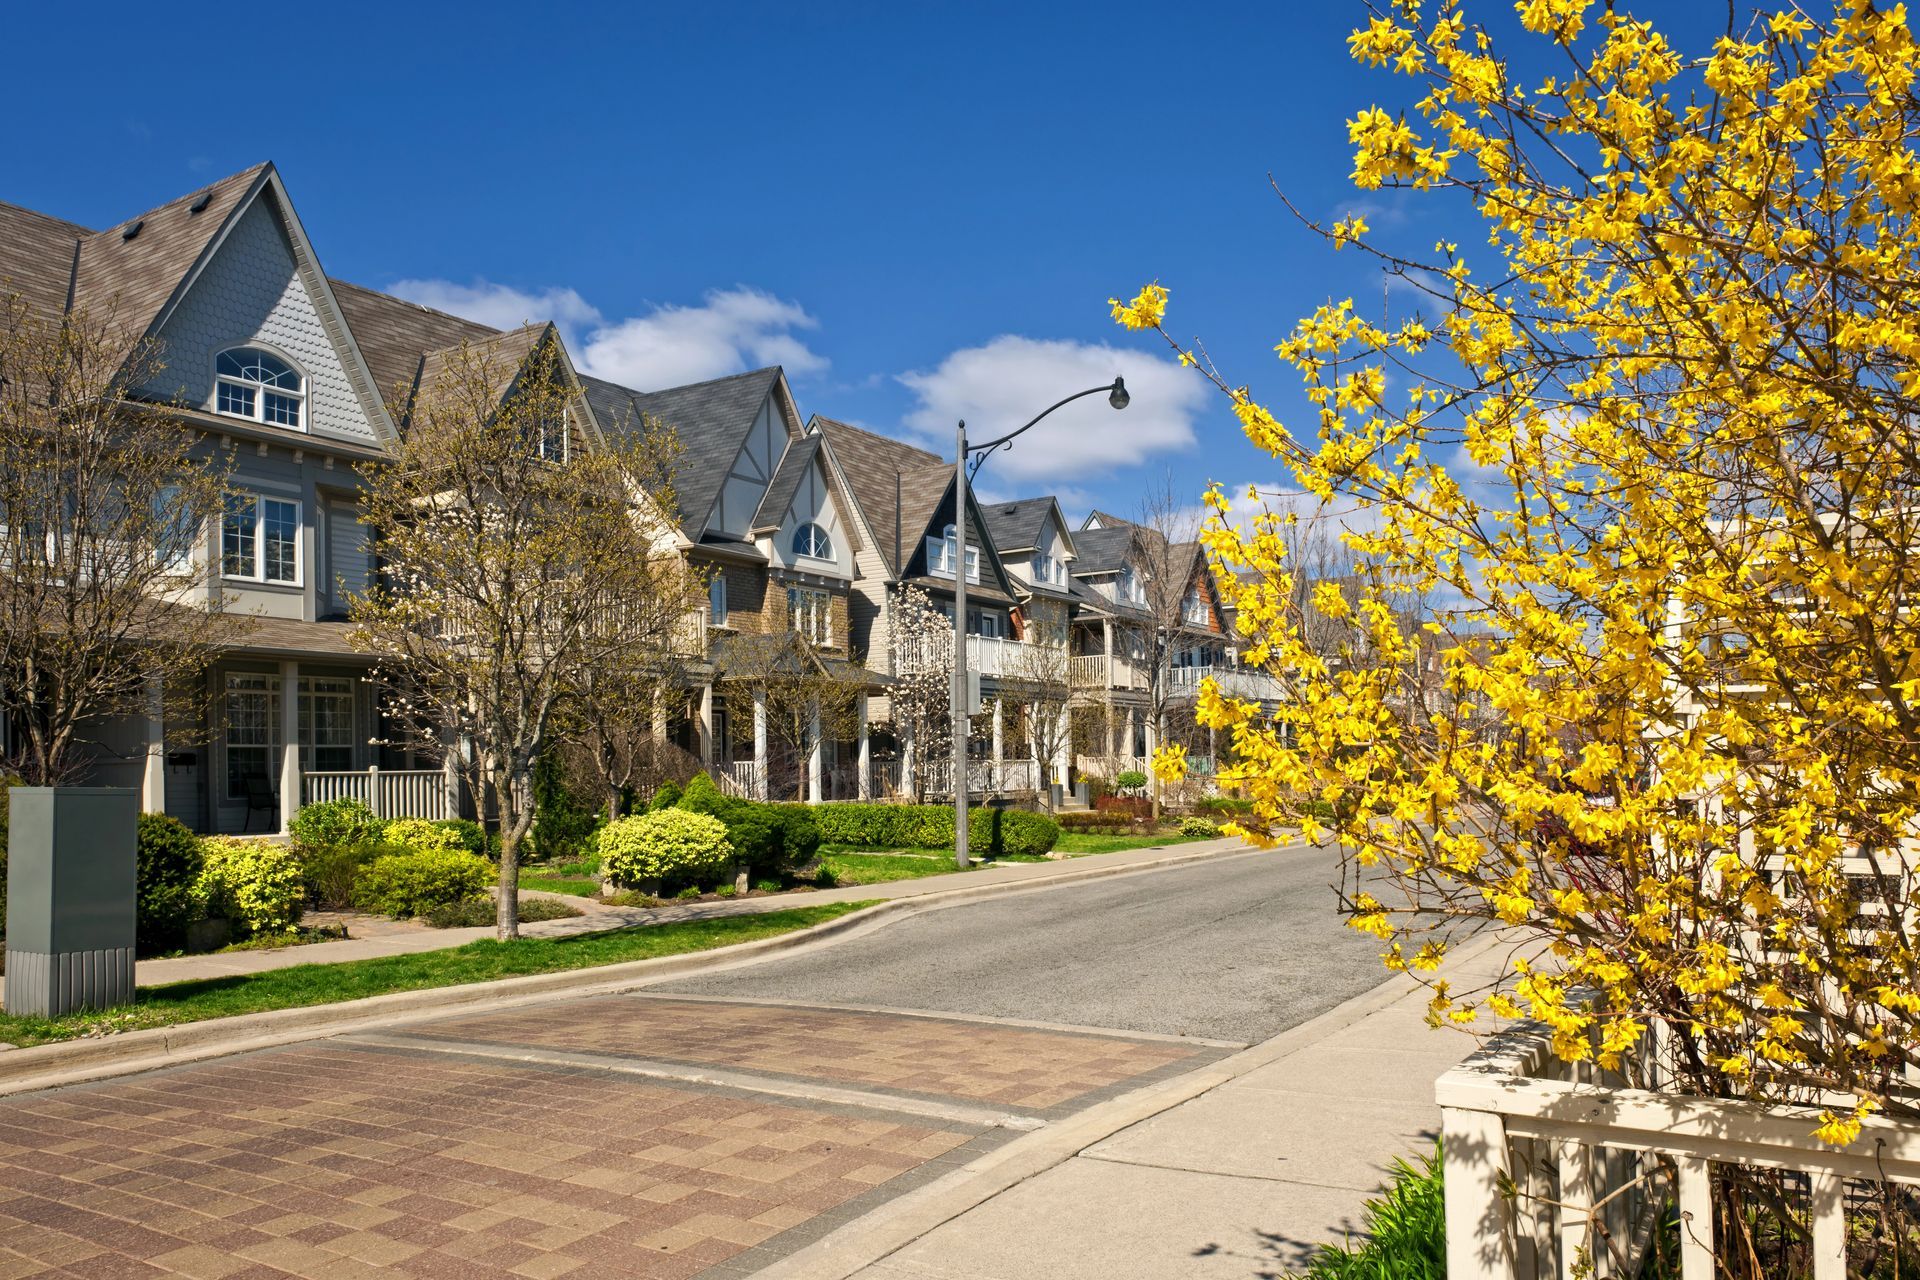
Guelph Real Estate Market – April 2019
Andra Arnold • June 18, 2019
Guelph Real Estate Market Update April 2019

Overall Market Data
Average Days on Market in 2018: #23
Average Days on Market in 2019: #21
The average amount of days for homes to be on the Guelph real estate market has decreased by 2 days.
Average Sale Price in 2018: $494,901
Average Sale Price in 2019: $536,464
From 2017 to 2018, the average sale price of Guelph homes has increased by 8%.
Units Sold in 2018: #219
Units Sold in 2019: #235
There has been an increase in homes sold in the Guelph real estate market over the month of April.
Neighbourhood Data

Average Days on Market
Average Days on Market in 2018: #28
Average Days on Market in 2019: #27
In the North End, homes have been on the Guelph real estate market for 1 day less on average.
Average Sale Price
Average Sale Price in 2018: $461,592
Average Sale Price in 2019: $487,822
There has been an increase in the average sale price of homes in the North End of Guelph by 5 % .
Units Sold
Units Sold in 2018: #19
Units Sold in 2019: #23
There have been 21% more units sold between April 2018 and April 2019.

Average Days on Market
Average Days on Market in 2018: #26
Average Days on Market in 2019: #20
For the South End of Guelph, homes have been on the Guelph real estate market for 6 days less on average.
Average Sale Price
Average Sale Price in 2018: $526,012
Average Sale Price in 2019: $573,628
There has been an increase in the average sale price of homes in the South End of Guelph by 9% .
Units Sold
Units Sold in 2018: #78
Units Sold in 2019: #87
There have been 12% more units sold in the South End from 2018 to 2019.

Average Days on Market
Average Days on Market in 2018: #17
Average Days on Market in 2019: #19
For the East End of Guelph, homes have been on the Guelph real estate market for 2 days more on average.
Average Sale Price
Average Sale Price in 2018: $467,347
Average Sale Price in 2019: $511,292
There has been an increase in the average sale price of homes in the East End of Guelph by 9% .
Units Sold
Units Sold in 2018: #41
Units Sold in 2019: #45
There has been an increase of 10% in units sold in the East End of Guelph from 2018 to 2019.

Average Days on Market
Average Days on Market in 2018: #18
Average Days on Market in 2019: #20
For the West End of Guelph, homes have been on the Guelph real estate market for 2 days more on average.
Average Sale Price
Average Sale Price in 2018: $391,568
Average Sale Price in 2019: $475,743
There has been an increase in the average sale price of homes in the West End of Guelph by 21 % .
Units Sold
Units Sold in 2018: #25
Units Sold in 2019: #42
There have been 68% more units sold in the West End from April 2018 to 2019.

Average Days on Market
Average Days on Market in 2018: #22
Average Days on Market in 2019: #22
For Downtown Guelph, homes have been on the Guelph real estate market for the same amount of time on average.
Average Sale Price
Average Sale Price in 2018: $525,494
Average Sale Price in 2019: $574,165
There has been an increase in the average sale price of homes in the Downtown Guelph by 9% .
Units Sold
Units Sold in 2018: #52
Units Sold in 2019: #34
There have been 35% fewer units sold in Downtown Guelph from 2018 to 2019.

Average Days on Market
Average Days on Market in 2018: #36
Average Days on Market in 2019: #21
Puslinch homes have been on the market for 15 days less on average.
Average Sale Price
Average Sale Price in 2018: $1,126,500
Average Sale Price in 2019: $1,462,500
There has been an increase in the average sale price of homes in Puslinch by 30% .
Units Sold
Units Sold in 2018: #8
Units Sold in 2019: #2
There have been -75% fewer units sold in Puslinch from 2018 to 2019.
To view current Guelph listings, click here !
If you have any questions about the Guelph Real Estate Market, feel free to contact Guelph Realtor Andra Arnold
The post Guelph Real Estate Market – April 2019 appeared first on Andra Arnold - Realtor Guelph.
Meet the Andra Arnold Team
Check Out Our Featured Listings
More blog posts on buying and selling real estate

Learn what buyers expect when selling a home in Guelph in 2026, from staging and pricing strategy to marketing, timing, and offer presentation.
Comparing Guelph homes for sale? Learn the hidden factors that affect ownership costs, resale value, zoning, and long-term satisfaction before you buy.

Selling your home in Guelph? Learn when accepting a Sale of Buyer’s Home condition makes sense, how to reduce risk, and what sellers should consider.

Best deals on Guelph homes come from preparation, local insight, and understanding location, condition, timing, neighbourhood trends, and negotiation strategy.
A guide to Guelph homes for sale in 2026 explained with current prices, neighbourhood insights, home types, and expert buyer tips to help you buy.

Guelph’s Andra Arnold wins Ontario REALTOR® of the Year. Learn about her record-breaking 2025 success and her support for the Royal LePage Shelter Foundation.